
Chartmetric logo
Chartmetric has long afforded the music industry access to authoritative listenership stats and engagement insights. Now, to enhance users’ experiences and career results, the one-stop data platform has debuted a ‘v2’ update that optimizes existing offerings and adds new features.
Music data platform Chartmetric has recently launched an ambitious ‘v2,’ which includes multiple capability additions and several functionality-focused improvements. On the functionality front, Chartmetric told Digital Music News that v2 delivers a more seamless and responsive overall platform to users.
“The version two experience is just a little bit more delightful,” Chartmetric VP of engineering Jay Hung told DMN. “It’s a little bit faster. And on certain pages, as you’re loading up a dashboard, it will be noticeable that it loads quicker and is easier to use. As you click on stuff, all the interaction is smoother.”
But bolstered stability and shorter loading times only scratch the surface of the v2 update, which includes a multifaceted tracks list feature.
Through the latter, Chartmetric users can navigate to a comprehensive collection of tracks and instantly view stats, including stream totals and playlist counts on services such as Spotify, YouTube, and Apple Music. TikTok likes, posts, and views are also a big part of the tracks list dashboard, which can be filtered to display songs by genre and listenership changes on specific platforms.
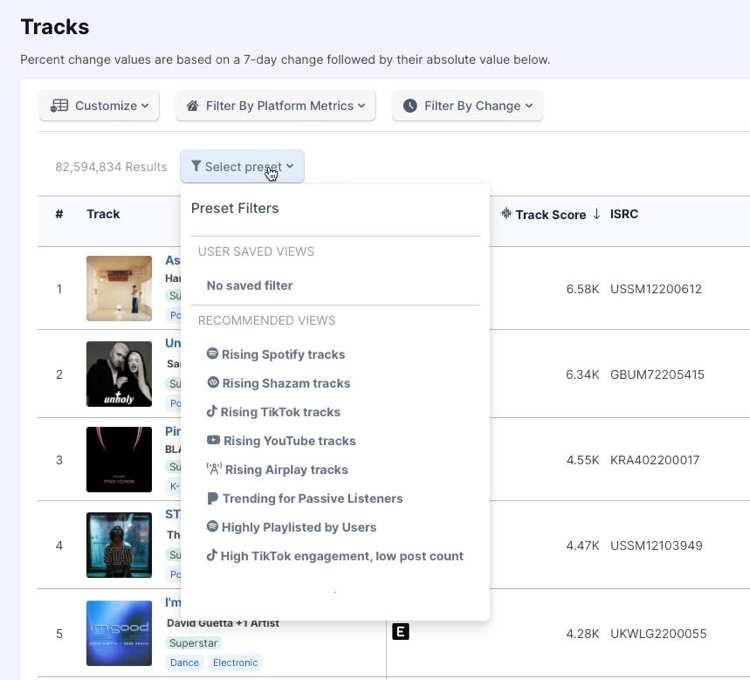
Chartmetric’s new tracks list feature enables users to apply a number of filters to songs and save their preferred metrics as presets for quick access.
Expanding upon the TikTok tracks list options, Chartmetric has introduced a full-scale TikTok comparison tool that, as its name suggests, allows users to see how the video-sharing app’s Sounds stack up against one another.
On the music side, the tool shows the stats behind each country’s top songs, with an option to filter by date to gain insight into trends and events. And beyond the performance of Sounds themselves, v2 has equipped Chartmetric with the data behind TikTok’s top users, viral videos, and related developments.
“These comparison tools allow you to take TikTok Sounds and basically line them up with each other,” Hung told us. “One might have gone viral last month, one might be going viral right now. And you can compare the trends to get an idea of what to expect or see what happened to a track before a spike. Then you can use these comparisons to make better decisions around what to do, where to promote, and how to bump a track up a little bit more to help it go viral.”
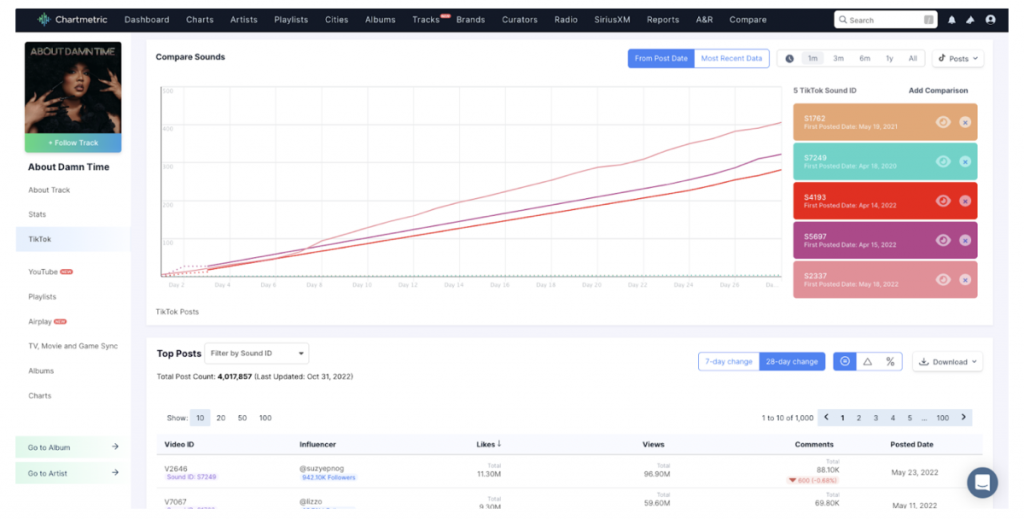
Chartmetric has added a TikTok comparison tool through its v2 update, including side-by-side views of songs’ on-platform performance.
Given the ongoing popularity of the short-form video space, the TikTok comparison tool could be built out to include Instagram Reels and YouTube Shorts down the line, Chartmetric told us, depending on the availability of data and its potential value for artists.
The possibility is particularly noteworthy on the Shorts side because Chartmetric already measures “user sentiment” by analyzing comments on the YouTube videos in which songs appear – meaning that fans’ telling opinions of trends and tracks can be identified in seconds.
“Our YouTube sentiments feature will go and find matched YouTube videos for a song and analyze the comments to get some insight into the sentiment of the commenters,” Hung explained.
Furthermore, Chartmetric has already started expanding the v2 update by adding a new artist-comparison interface.
Now, Chartmetric users can compare up to 10 artists’ performance metrics, covering everything from Wikipedia views to Spotify monthly listeners and TikTok likes to YouTube views, simply by searching for and selecting creators through a responsive menu. Then, the desired information will populate an interactive graph showing daily and percentage changes.
Several of the artist-comparison tool’s categories (Spotify listeners and YouTube views among them) can display results by location (city as well as country). Users can also add data points for “milestones” that impact engagement and provide useful context, such as releases, events, playlist ads, and even television appearances, with a click or tap.
Adjacent to these milestones, Chartmetric has started compiling artists’ achievements (breaking 50,000 Spotify followers, for example) with v2, while an album-comparison tool, like its artist counterpart, can illustrate the commercial performance of a creator’s releases in detail.
Also live as part of Chartmetric v2’s post-release additions are a profile-claim feature (which artists can use to obtain permissions to edit and manage their data for accuracy), retooled designs for reports and PDF exports, a new search-results page, and integrations with electronic press kit (EPK) generation platform OneSheet (Chartmetric acquired OneSheet in early October).
For artists, the far-reaching significance of data in today’s digital-driven music space goes without saying. Streaming now accounts for the majority of industry revenue, and social platforms factor prominently into all manner of promotional campaigns.
Consequently, it’s more important than ever for members of the music community to capitalize upon the precise numbers around tracks and fan interest. Especially with the v2 update (and its helpful post-release features) in place, Chartmetric is affording artists a quick and effective means of quantifying their reach and maximizing their professional successes.